
Guide
What are restaurant sales reports and analytics?
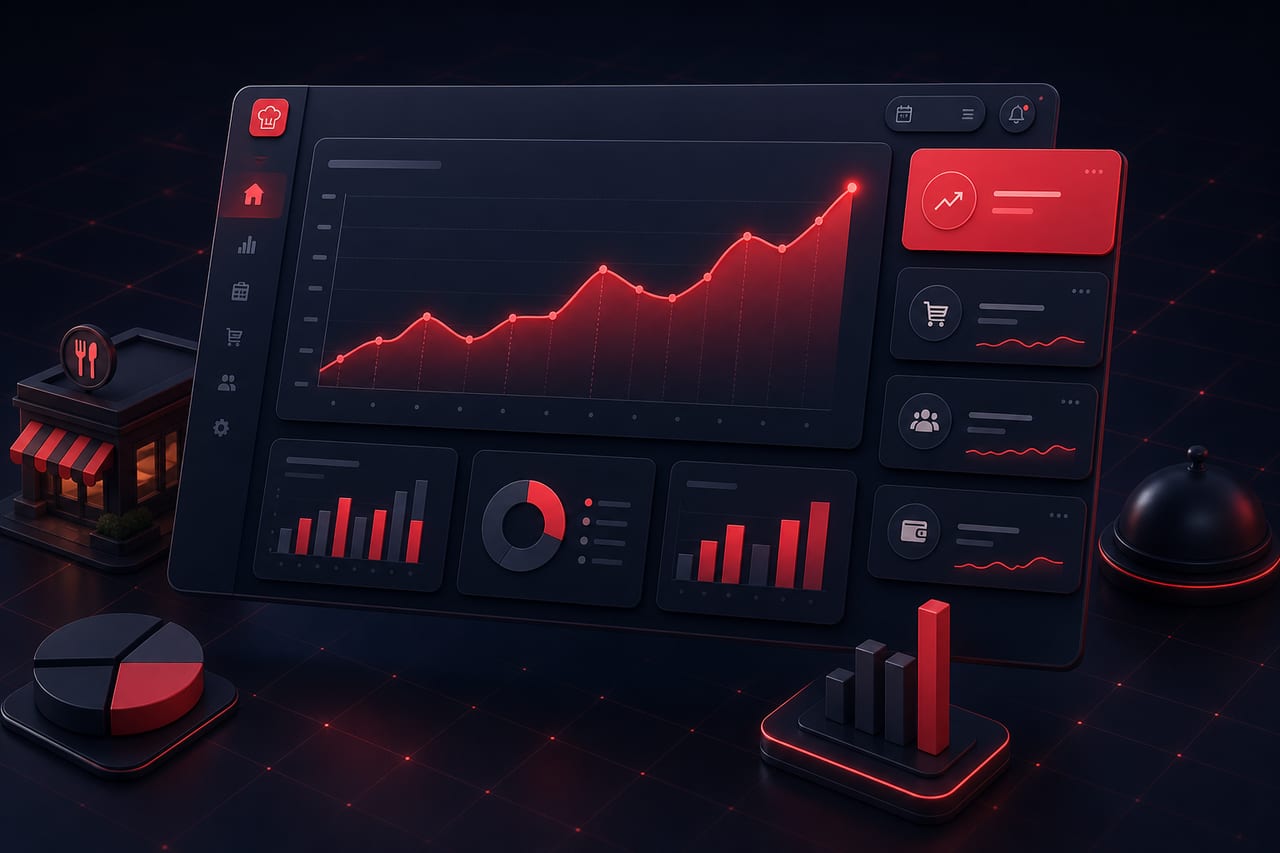
Sales reports and analytics turn the data from your orders (count, revenue, date, branch, channel) into meaningful charts and tables so you can see clearly how the business is performing.
Short answer
Restaurant analytics is the reporting layer that turns your order data into decision-ready insight: total orders and revenue for a period, the daily trend, the change versus the previous period (up/down) and per-branch breakdowns. In Dijifis daily totals are summarised in the background (rollups), so reports load fast and you can export the data as CSV.
Definition
Sales analytics is a system that aggregates and summarises raw order records (each order's date, amount and line items). The core outputs are total order count, total revenue, the daily order/revenue trend and a comparison of your chosen period against the equivalent previous period.
For multi-branch businesses each branch (tenant) is calculated separately and combined in one dashboard. For performance, daily data is summarised ahead of time at regular intervals (daily aggregate), so even wide date ranges report quickly and past days can be filled in retroactively (backfill).
How does it work?
Reporting typically proceeds through these steps:
- Every completed order is stored with its date, amount and line items.
- Daily totals (order count + revenue) are summarised in the background per branch.
- You select a date range; the dashboard shows the period total and the daily trend.
- Your chosen period is compared with the equivalent previous period, and the difference (delta) appears as a percentage/count.
- When needed you export the branch breakdown and daily trend as CSV for use in accounting or a spreadsheet.
Benefits
Good reporting lets you manage with data, not guesswork.
See the trend instantly
With a daily order and revenue chart you understand at a glance which way things are going.
Period comparison
Compare this month with last month, this week with last week, and measure real growth.
Per-branch view
In a multi-branch business you see how each branch is performing separately.
Export
Download the data as CSV and use it freely in accounting or your own spreadsheets.
Best practices
To get the most from reports:
- Compare periods of equal length (30 days to 30 days) so the comparison is fair.
- Note campaign and holiday days; that explains spikes in the trend.
- Review the branch breakdown weekly to catch weak performance early.
- Track order count and average basket alongside revenue, not revenue alone.
- Export end-of-month data as CSV and reconcile it with accounting records.
Related guides and solutions
Frequently asked questions
- Which metrics can I see?
Total order count, total revenue, the daily order/revenue trend, a comparison of your chosen period with the previous period, and a per-branch breakdown for multi-branch businesses.
- Why do the reports load so fast?
Because daily totals are summarised ahead of time (rollup/daily aggregate), even wide date ranges are reported quickly without re-scanning every order.
- Can I export the data?
Yes. You can download the branch breakdown and daily trend as CSV and use it in spreadsheets or accounting software.
- Is data from past days included in reports?
Yes. Because daily summaries can be filled in retroactively (backfill), past periods are reported consistently too.
Summary
Sales reports and analytics turn your order data into decision-ready insight: total orders and revenue, the daily trend, comparison with the previous period and a branch breakdown. Because daily totals are summarised ahead of time, reports load fast; you can export the data as CSV and use it in accounting and planning.
Get started
Contact us about an online ordering solution for your business and start taking orders on your own channel with Dijifis.